Discovering hidden patterns in data
One of the greatest challenges in modern science is how to get useful conclusions from massive datasets. Dr Eric Chi, of North Carolina State University in the US, develops innovative ways to discover the information hidden within data, helping with a range of societal issues
TALK LIKE A DATA SCIENTIST:
DATA – anything that can be recorded or measured
DATA CLUSTERING – dividing data points into groups, where data points within each group are more similar to each other than those in other groups
DATA CUBE – a multi-dimensional array of values
INFORMATION EXPLOSION – the rapid increase in the amount of available data, brought about by technological progress in areas such as computing power and the internet
NEUROSCIENCE – the scientific study of the nervous system
OPEN SOURCE – software where the original source code is made freely available
STATISTIC – computed summarisation of data that helps interpret the data
VARIABLE – a factor whose value changes in a scientific experiment
In our modern age of computing, we have the tools to collect massive amounts of data on all kinds of subject matters, but the challenge is building the tools to interpret this data to draw meaningful conclusions. At the Statistics Department of North Carolina State University, Assistant Professor Dr Eric Chi is tackling this issue and using mathematical concepts to tease information out of complex datasets.
WHEN DATA GETS COMPLICATED
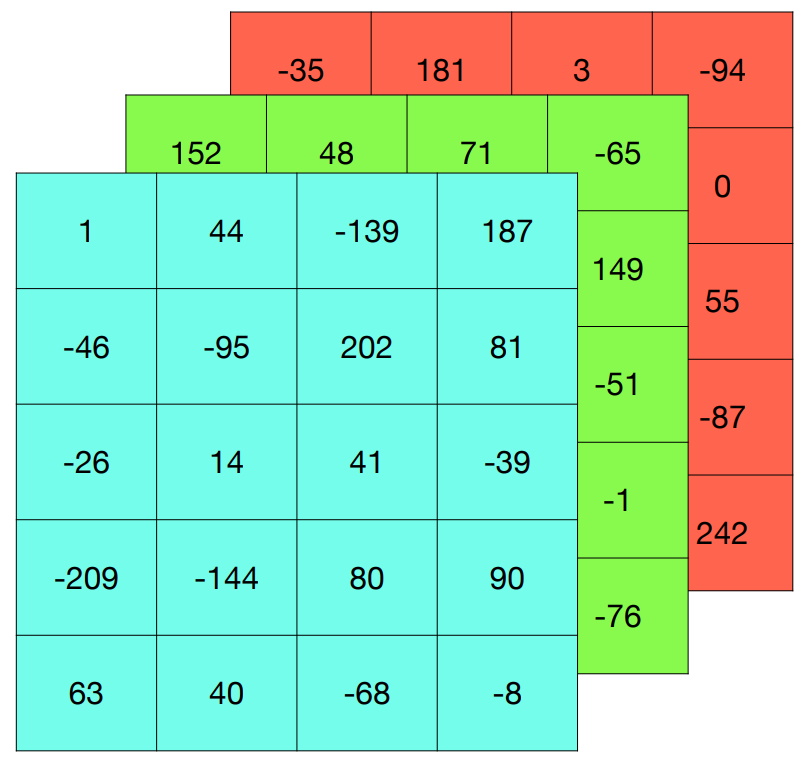
One of Eric’s current projects involves finding patterns in data cubes. An example of a data cube is a three-dimensional dataset – each dimension could have multiple variables. Generally, humans are better at seeing patterns in two dimensions, such as a graph with x and y axes. When we add more dimensions, things start to get complicated.
Neuroscience is one scientific field where new recording techniques have meant that the quantity of data available to us has exploded in recent decades. For instance, the activity of neurons (nerve cells) in the brain can be measured using three dimensions: time, the specific neuron involved, and the experimental conditions involved. This can be stored in three-dimensional space to form a data cube. “We’ve been working on methods to analyse such data,” says Eric. “We want to see if we can identify neuronal firing patterns and how they change over time, under different experimental conditions. This will help neuroscientists better understand the brain.”
SORTING BY SIMILARITY
“The idea of clustering is to group a collection of datapoints in such a way that members in the same group are very similar to each other, while very different from members in other groups,” says Eric. This helps us to visualise data in separate ‘clusters’, which then helps us to understand the data. For instance, if you collect data on environmental and genetic factors of individuals, you can cluster these observations to make progress towards understanding who is more likely to get a certain disease and to gauge how much individuals might be at risk. Clustering is an example of exploratory data analysis – a first step in developing models for making predictions that can guide clinical decision making.
It can also help us to understand more complex data. “Suppose you work for an online streaming platform,” says Eric. “You have data on your customers and on the films you host, and you want to group your customers so the algorithm can recommend movies to them based on their preferences.” This involves clustering of data along two different dimensions: the type of customer, and the type of movie. This is called biclustering. It is useful because not only can you identify that a particular customer has similar movie selection habits to others, you can also identify movies that fit within that category to recommend to them.
PATTERNS IN SENATE VOTING BEHAVIOUR
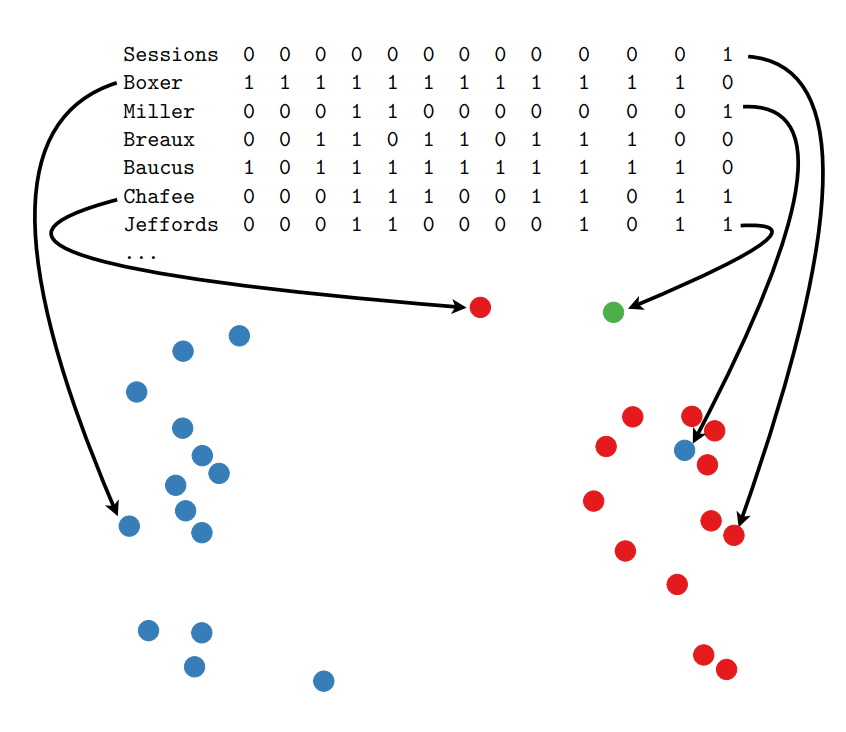
“Imagine you have a three-dimensional object and shine a light onto it, so it casts a shadow,” says Eric. “This shadow is a two-dimensional projection.” Sometimes, we can have a fair idea what an object looks like just from its shadow. Eric uses the equivalent of this ‘dimension reduction’ technique to make datasets easier to understand.
“Take the US Senate’s roll call voting data, for example,” says Eric. “Senators will vote ‘yes’ or ‘no’ on a huge array of different measures such as social, military and environmental concerns. At first it may seem these issues have little in common, but there’s actually a lot of structure to how senators vote on them.” Eric can use dimension reduction to plot these voting patterns of different senators in two-dimensional space. Perhaps unsurprisingly, the results show that senators’ voting patterns tend to be most similar to others within the same political party. More interestingly, however, the results also reveal an axis that identifies within party variation for both parties.
For instance, if one senator is ‘close’ to another on the two-dimensional projection, chances are they will vote the same way. This same idea can be used for all sorts of scenarios. For instance, scientists might be interested in how a new pharmaceutical chemical is likely to behave. By using dimension reduction, they can compare its characteristics (e.g. structure, composite atoms, etc.) to existing chemicals. It is likely to behave similarly to those it is ‘close’ to on the plot.
 DR ERIC CHI
Assistant Professor, Statistics Department, North Carolina State University, USA
FIELD OF RESEARCH: Statistics and Data Science
RESEARCH PROJECT: Developing statistical methods for exploring and analysing complex datasets.
FUNDER: National Science Foundation
This work was supported by the NSF, under award numbers DMS-1752692 and DMS-1454942. The contents are solely the responsibility of the authors and do not necessarily represent the official views of the NSF.
Reference
https://doi.org/10.33424/FUTURUM103


TALK LIKE A DATA SCIENTIST :
DATA – anything that can be recorded or measured
DATA CLUSTERING – dividing data points into groups, where data points within each group are more similar to each other than those in other groups
DATA CUBE – a multi-dimensional array of values
INFORMATION EXPLOSION – the rapid increase in the amount of available data, brought about by technological progress in areas such as computing power and the internet
NEUROSCIENCE – the scientific study of the nervous system
OPEN SOURCE – software where the original source code is made freely available
STATISTIC – computed summarisation of data that helps interpret the data
VARIABLE – a factor whose value changes in a scientific experiment
In our modern age of computing, we have the tools to collect massive amounts of data on all kinds of subject matters, but the challenge is building the tools to interpret this data to draw meaningful conclusions. At the Statistics Department of North Carolina State University, Assistant Professor Dr Eric Chi is tackling this issue and using mathematical concepts to tease information out of complex datasets.
WHEN DATA GETS COMPLICATED
One of Eric’s current projects involves finding patterns in data cubes. An example of a data cube is a three-dimensional dataset – each dimension could have multiple variables. Generally, humans are better at seeing patterns in two dimensions, such as a graph with x and y axes. When we add more dimensions, things start to get complicated.
Neuroscience is one scientific field where new recording techniques have meant that the quantity of data available to us has exploded in recent decades. For instance, the activity of neurons (nerve cells) in the brain can be measured using three dimensions: time, the specific neuron involved, and the experimental conditions involved. This can be stored in three-dimensional space to form a data cube. “We’ve been working on methods to analyse such data,” says Eric. “We want to see if we can identify neuronal firing patterns and how they change over time, under different experimental conditions. This will help neuroscientists better understand the brain.”
SORTING BY SIMILARITY
“The idea of clustering is to group a collection of datapoints in such a way that members in the same group are very similar to each other, while very different from members in other groups,” says Eric. This helps us to visualise data in separate ‘clusters’, which then helps us to understand the data. For instance, if you collect data on environmental and genetic factors of individuals, you can cluster these observations to make progress towards understanding who is more likely to get a certain disease and to gauge how much individuals might be at risk. Clustering is an example of exploratory data analysis – a first step in developing models for making predictions that can guide clinical decision making.
It can also help us to understand more complex data. “Suppose you work for an online streaming platform,” says Eric. “You have data on your customers and on the films you host, and you want to group your customers so the algorithm can recommend movies to them based on their preferences.” This involves clustering of data along two different dimensions: the type of customer, and the type of movie. This is called biclustering. It is useful because not only can you identify that a particular customer has similar movie selection habits to others, you can also identify movies that fit within that category to recommend to them.
PATTERNS IN SENATE VOTING BEHAVIOUR
“Imagine you have a three-dimensional object and shine a light onto it, so it casts a shadow,” says Eric. “This shadow is a two-dimensional projection.” Sometimes, we can have a fair idea what an object looks like just from its shadow. Eric uses the equivalent of this ‘dimension reduction’ technique to make datasets easier to understand.
“Take the US Senate’s roll call voting data, for example,” says Eric. “Senators will vote ‘yes’ or ‘no’ on a huge array of different measures such as social, military and environmental concerns. At first it may seem these issues have little in common, but there’s actually a lot of structure to how senators vote on them.” Eric can use dimension reduction to plot these voting patterns of different senators in two-dimensional space. Perhaps unsurprisingly, the results show that senators’ voting patterns tend to be most similar to others within the same political party. More interestingly, however, the results also reveal an axis that identifies within party variation for both parties.
For instance, if one senator is ‘close’ to another on the two-dimensional projection, chances are they will vote the same way. This same idea can be used for all sorts of scenarios. For instance, scientists might be interested in how a new pharmaceutical chemical is likely to behave. By using dimension reduction, they can compare its characteristics (e.g. structure, composite atoms, etc.) to existing chemicals. It is likely to behave similarly to those it is ‘close’ to on the plot.
DR ERIC CHI
Assistant Professor, Statistics Department, North Carolina State University, USA
FIELD OF RESEARCH: Statistics and Data Science
RESEARCH PROJECT: Developing statistical methods for exploring and analysing complex datasets.
FUNDER: National Science Foundation
This work was supported by the NSF, under award numbers DMS-1752692 and DMS-1454942. The contents are solely the responsibility of the authors and do not necessarily represent the official views of the NSF.
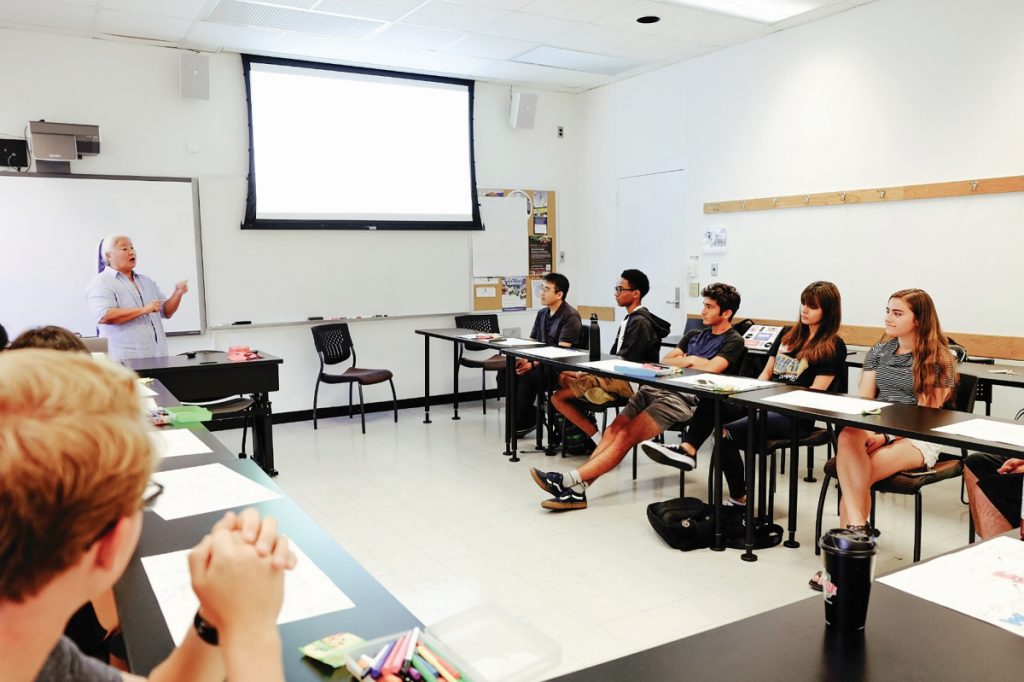
 WHAT WERE THE MAIN ACTIVITIES YOU TOOK PART IN ON THE DST PROGRAMME?
The DST programme is all about exposing teenagers to the field of data science. I had the opportunity to interview data scientists working in different fields, as well as touring SAS Institute’s (a leading data and analytics company) facility in Cary and having conversations with employees about their career paths. During the school year, we met once a month to work on a data analysis project, which culminated with the North Carolina Junior Science and Humanities Symposium.
WHAT WAS YOUR SPECIFIC PROJECT?
I worked with one other student and Dr Chi. We analysed the patterns on assaults committed in the town of Raleigh, in terms of where they took place and at what times. We used some analytical methods to capture the underlying patterns and create a simulated dataset that was much smaller. This allowed us to create more meaningful, less cluttered visualisations of the data.
WHAT DID YOU GAIN FROM TAKING PART IN THE PROGRAMME?
I found the career guidance offered really beneficial in understanding what a data science career means. Ironically, it was helpful to learn that there isn’t any one path, but rather many different routes you can take. There are data scientists with a range of different qualifications, working on hugely varied projects, from streaming service recommendations to the patterns of degenerative diseases.
WHAT DO YOU FIND CHALLENGING ABOUT DATA SCIENCE?
It can be difficult to figure out how to start a project, since the overall process seems so daunting. I think that getting used to the independence of the workflow was challenging, but I am very proud of our accomplishments. One of the most important aspects of data science is finding ways to represent data meaningfully, so I found the visualisation part of the process really rewarding. It makes it clear that the process is not just an academic exercise, but has potential to bring real benefits to the world.
HOW DO YOU FIND NOW BEING A MENTOR?
Initially, my role was to bring the perspective of a student into the curriculum design of future DST programmes. In light of the Covid-19 pandemic, we wanted to work on a project that has more of a direct impact on students. Our team is working on a web application that can be used by teachers of computer science or statistics. It aims to help students determine which variables in a dataset are most useful for creating a statistical model.
WHAT’S NEXT FOR YOUR CAREER?
I am going to the University of Maryland at College Park in the autumn to study computer science. I plan to pursue a career in data science, and hope to use my skills to solve problems in the urban planning field.
ABOUT DATA SCIENCE
WHY IS DATA SCIENCE NEEDED?
Data science is a broad discipline that focuses on extracting knowledge from datasets, especially large or complex ones. The ‘information explosion’ of recent decades means that it has become a rapidly expanding and increasingly crucial field that many other fields of science rely upon to find meaningful conclusions.
“The methods I develop can be used as part of a complex data analysis process,” says Eric. His work is one piece of the puzzle; good science is heavily dependent on collaboration, and he has worked with scientists from a huge range of disciplines to help them make important breakthroughs. “It’s very rewarding to be part of the process,” he says.
HOW HAS INFORMATION SHARING HELPED OTHERS?
Collaboration, the sharing of ideas and methods, and interdisciplinary approaches are often vital in research – Eric is certainly one researcher who is keen to ensure his work can aid others. For instance, his code on biclustering is open source, which means that it is freely available on the internet and other people can easily incorporate the method into their own work. This code was recently used by cancer researchers to identify complicated relationships between certain genes and the likelihood of certain combinations of diseases developing. “One of the things I love about the work I do is that it combines beautiful mathematics with practical engineering to develop reliable tools for making scientific discoveries.”
WHAT DOES THE DATA SCIENTISTS IN TRAINING (DST) PROGRAMME OFFER PARTICIPANTS?
“I got into this career through an interest in mathematics, but that’s not the only route, by a long way,” says Eric. In collaboration with Dr Mary Ann Leung of The Sustainable Horizons Institute, he designed – and co-led with fellow NCSU Statistics faculty member Dr Ana-Maria Staicu – a programme that helps prospective students explore the various ways to pursue a career in data science. “One activity involves participants interviewing a data scientist,” says Eric. “These scientists may work in academia, industry, or government. Participants find out about their career pathway and share what they’ve learnt with the rest of the group.”
Participants also work on a year-long team-based research project that allows them to get hands-on with data science methods. “One thing I like about data science is that a lot of strategies are quite intuitive,” says Eric. “This means that a curious high school student can readily grasp the idea behind many techniques. The goal of this programme* is to spark curiosity and give participants guidance on future choices in their education.”
* In addition to the NSF, the programme gratefully acknowledges receiving logical support and planning from The Science House at NCSU, computer resources from NCSU’s College of Sciences Information Technology, and financial support from The Statistical and Applied Mathematical Sciences Institute, (SAMSI) and RStudio.
HOW DID ERIC BECOME A DATA SCIENTIST?
WHAT INSPIRED YOU TO CHOOSE YOUR CAREER?
If I had to blame one person for setting me on this career path, it would be my high school geometry teacher! He shared his delight in elegant proofs, with all of his students, and helped me develop my interests and tastes early on.
WHAT SKILLS HAVE YOU FOUND USEFUL FOR YOUR AREA OF EXPERTISE?
Statistics is a very broad field, but my research focuses on machine learning and algorithm development. To get into this particular area, courses like real analysis, linear algebra, and probability are useful for the mathematical side of things. There is also the computing element, where courses on optimisation, coding and software engineering are extremely helpful. Together, these provide a solid foundation for learning more specific skills.
WHAT INSPIRES YOU TO MENTOR FOR THE DST PROGRAMME?
I had a lot of good mentors throughout high school, college, and beyond. I wouldn’t be where I am today without them. It’s rewarding to play a small part in getting young students interested and curious about maths, statistics and data science.
• As Eric mentions, data scientists are needed for a massive range of disciplines, not only within academia but also in business management, marketing, tech, and governance.
• There are a few universities that teach data science at undergraduate level. In the UK, this includes Russell Group universities such as London School of Economics, Warwick, and Exeter.
• University courses in other subjects, such as mathematics, are also recognised routes for a career in data science. According to Top Universities, the best institutions for studying mathematics are MIT, Harvard, Stanford, Cambridge and Oxford.
• According to Glassdoor, the average data scientist in the US makes $113,300 a year.
PATHWAY FROM SCHOOL TO DATA SCIENTIST
• Eric says that there are many different ways to pursue a career in data science. Studying statistics, mathematics, computer science or electrical engineering at university are all very viable options.
• At high school, useful subjects to take to prepare for degrees like these include mathematics, statistics and computer science.
• It is always worth exploring extracurricular means to increase your experience. There are a wide range of programmes that can help with this, such as the DST programme that Eric designed. Others include the MIDAS Data Science Summer Camp in Michigan, the Data Science Academy at Georgetown University, and the Data Science for Women Summer Camp in Ohio State University.
ERIC’S TOP TIPS FOR STUDENTS
1. Don’t be afraid to try new things and to fail sometimes.
2. There are a lot of good free resources out there that will help you with your career. For instance, a free coding course for Python can be invaluable for getting into machine learning.
3. Take ownership of your future but be patient with yourself. It can take time to figure things out but it’s important to explore.
Write it in the comments box below and Eric or Justin will get back to you. (Remember, researchers are very busy people, so you may have to wait a few days.)