How can we unravel the complex history of networks?
Infectious diseases, such as COVID-19, can spread rapidly from person to person, resulting in a vast and complex network of infected individuals. Throughout your life, you will meet new people, make new friends and form new relationships, building an ever-evolving social network. At Rutgers University in the US, Dr Min Xu has developed a model that can unpick the history of networks such as these, helping everyone from epidemiologists to counter-terrorism investigators.
Talk like a network analyst
Bayesian statistics — the branch of statistics based on the Bayes rule, which states the probability of an event if a related event is known to have occurred
Community — a cluster of tightly connected nodes
Edge — the connection between two nodes in a network e.g., the relationship between two people in a social network
Epidemiology — the study of how diseases spread through populations
Markovian model — a model that describes how a random system changes over time
Network — an interconnected group of individuals
Node — an individual that is part of a network e.g., a person in a social network
Root node — the first node in a network
Transition kernel — a mathematical equation that states the probable ways in which an event could occur
Weight — the strength of an edge in a network
In December 2019, people in the Chinese city of Wuhan began to fall ill from an unidentified illness. Most people suffered no more than a bad cough, a lack of energy, and a loss of taste and smell. However, on the 11th of January 2020, the first confirmed death from this new type of coronavirus was reported. The victim was a 61-year-old man who was a regular customer at a local seafood market, where the COVID-19 pandemic is believed to have originated. Within three years, almost 7 million people around the world had died from COVID-19. How did this disease spread from a seafood market in central China to become the most disruptive global pandemic in living memory?
COVID-19 is an airborne virus, meaning it spreads via tiny droplets that are coughed, sneezed or breathed out by an infected person. If, over the course of a day, an infected person is in close proximity to ten other people, by the end of the day, those ten people may have breathed in the virus and become infected. The next day, each of these ten newly infected people may be in close contact with another ten people, meaning one hundred more people may become infected. In this way, diseases such as COVID-19 can spread rapidly among populations.
To understand how this happens, epidemiologists study the network of interactions between infected individuals. By tracking who an infected person has had contact with, they can predict where new outbreaks are likely to occur in the future and determine where the disease originated in the past.
However, these networks of interactions are highly complex, and analysing them is no easy task. Dr Min Xu, a statistician specialising in network analysis at Rutgers University, has developed a probabilistic model that can determine how a network has grown, which not only has applications in epidemiology, but is also useful in social science, genetics and counter-terrorism efforts.
What is a network?
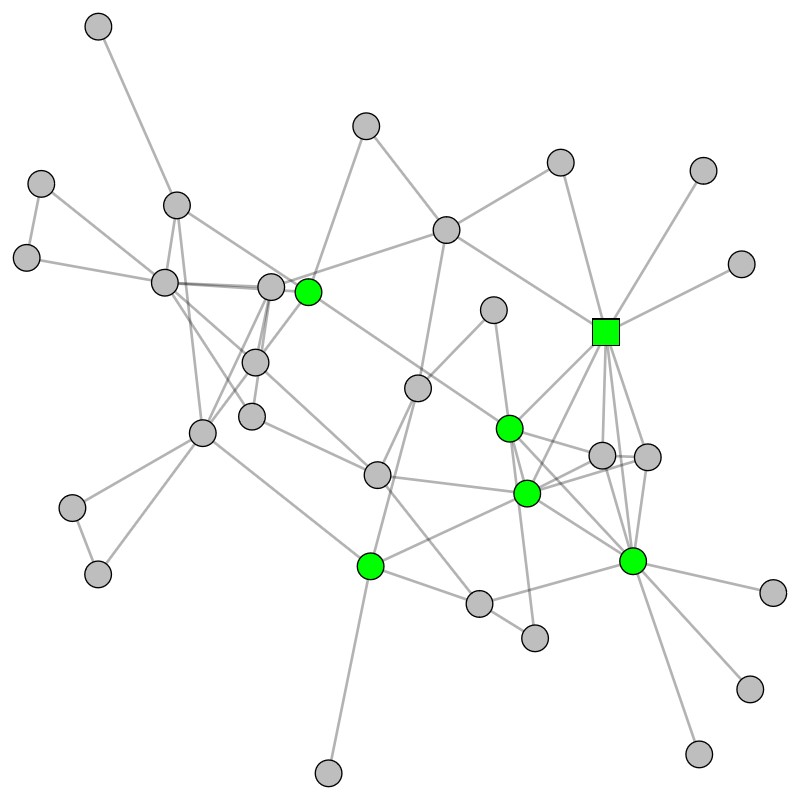
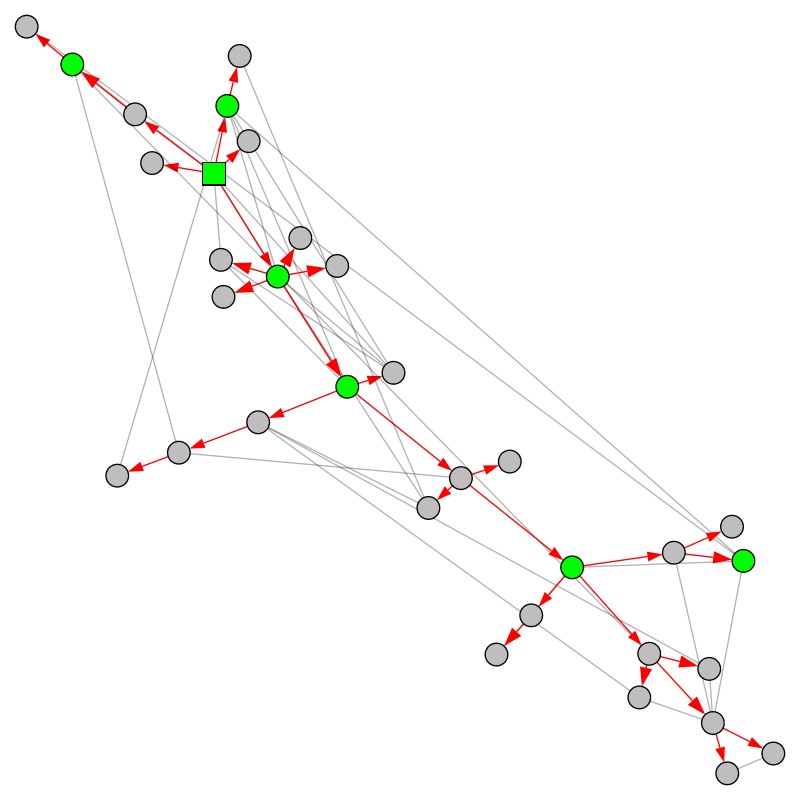
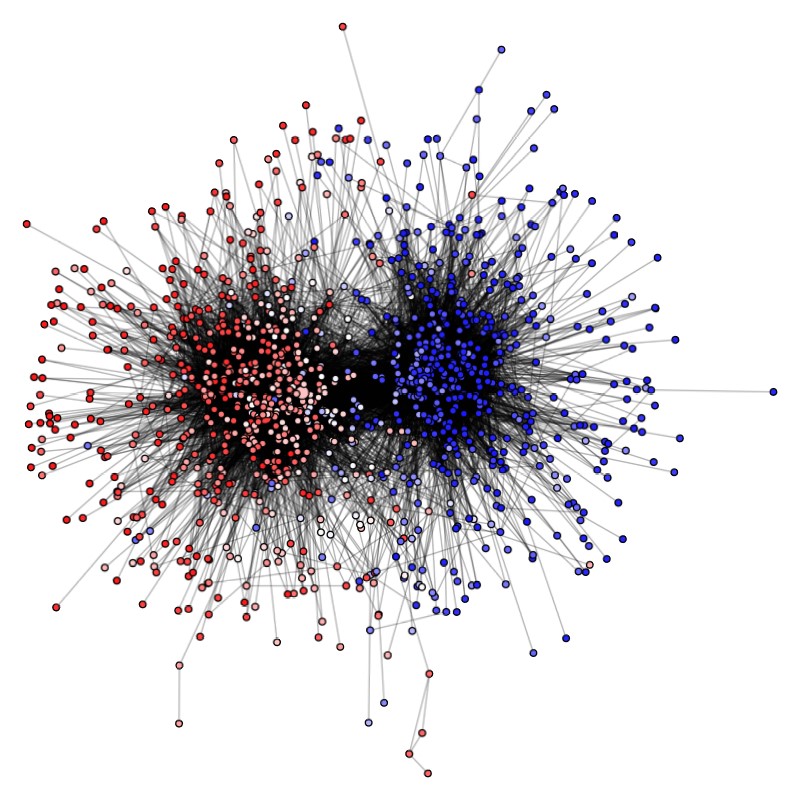
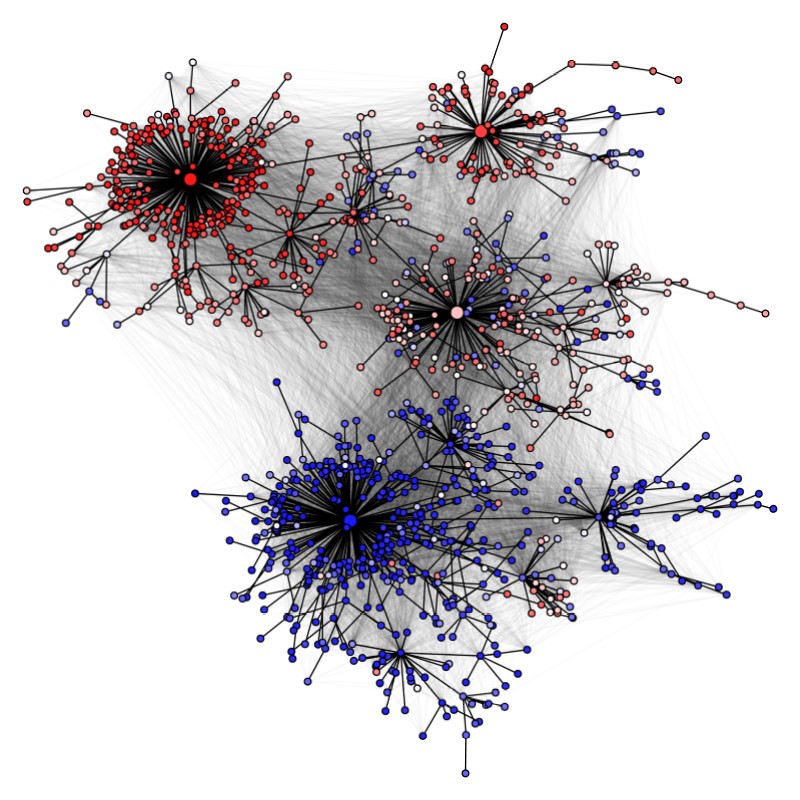
“A network is a mathematical model used to describe relationships (known as edges) between individuals (known as nodes),” explains Min. “Each edge may have a weight (that represents the strength of the relationship) and direction (if the relationship is one-way), and the root node is the first individual in the network.” For example, in a network of disease transmission, the root node would be ‘patient zero’, the first person to be infected. The nodes connected to the root node would be people infected by patient zero. As the network grows, extra nodes could be added as these newly infected people infect others. Within a network, there may be smaller communities of closer interactions. For example, while everyone who has had COVID-19 is connected in a huge global network, this can be broken down into smaller communities representing how people became infected in a single town or school.
What are other examples of real-world networks?
“Social networks are perhaps the most famous example of networks,” says Min. In a social network, each node is a person, and each edge represents a relationship between two people. In your social network, you are connected to your family members, friends and acquaintances by relationships of different strengths, forming communities that represent different social interactions in your life. For example, you may have communities of siblings, close friends, sports team members and classmates. Your family members, friends and acquaintances may also be connected to each other, forming a complex interconnected network. Researchers often gather information about social networks from social media platforms, where relationships can be identified when individuals are ‘friends’ or ‘following’ each other.
Geneticists model networks of gene expression, where each node is a gene and edges exist between genes that are often expressed together. Counter-terrorism investigators study the networks within terrorist organisations, where each known terrorist is a node, and edges represent communications between terrorists. Academics collaborate with each other when they conduct research, forming networks of researchers (nodes) who work together (edges) on projects.
Why is it useful to study the history of a network?
“Real-world networks start small and grow over time,” says Min. For example, your social network has grown as you have grown because, as you got older and met new people, you formed new relationships. Throughout your life, your social network will continue to evolve – you will add new nodes as you make new friends, and the weight of some edges may diminish as you lose contact with old friends.
“The history of a network gives us important information about how the network is organised,” explains Min, “and it can tell us about the formation of different communities in the network.” For example, determining the history of a disease network could enable an epidemiologist to uncover how a disease has spread through a population, including how it has spread between and within different regions, by locating ‘patient zero’ in each community.
How does Min infer the history of a network?
Reference
https://doi.org/10.33424/FUTURUM425
It is very challenging to uncover the history of a network. “We only see the final network in its current form,” says Min. “We cannot look back in time to see what it was like in the past.” This means it is impossible to definitively reconstruct a network’s full history, but statisticians can make educated guesses about the network’s early history.
Min has developed a Markovian model that can analyse networks and infer their history. “A Markovian model describes how a random system evolves over time,” he explains. “It breaks down the evolution process into a sequence of steps and specifies the transition kernels that state the probable ways in which each step could occur.”
Min’s Markovian model allows him to assess the probability that different potential histories have resulted in the final network. To apply his model to real-world networks, Min uses tools from Bayesian statistics, which uses the Bayes rule to invert a probabilistic statement. “If we know how likely event B is to occur, given that event A has occurred, the Bayes rule lets us calculate the reverse – how likely is event A, given that event B has occurred?” he explains. “In the context of Markovian network models, the Bayes rule lets us ‘invert’ time.” Based on the final state of a network and the transition kernels, Bayesian statistics allows Min to determine which network histories are most likely to be correct.
Why is this model important?
Min has collaborated with researchers from other disciplines to apply his model to real-world networks. “We worked with geneticists to apply our model to a gene interaction network related to a genetic abnormality that can cause miscarriage during pregnancy,” says Min. “From the network alone, we identified important genes linked to this genetic condition.” Min is continuing this collaboration to help geneticists understand which genes are important in different genetic diseases.
He has also applied his model to examine research collaborations between academics. His model accurately identified communities of researchers who work together and extracted root nodes that corresponded to influential figures in each research community, highlighting the model’s ability to analyse a network successfully. Based on these results, Min is hopeful that his model will allow researchers to infer the history of a wide range of different networks, helping them to investigate everything from infectious diseases to terrorist organisations.
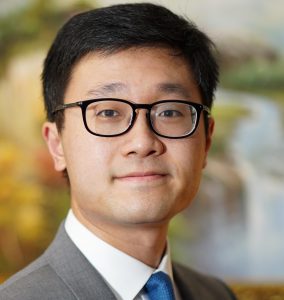 Dr Min Xu, Department of Statistics, Rutgers University, USA
Fields of research: Network Analysis, Probability, Statistics
Research project: Developing a probabilistic model to describe the growth and evolution of real-world networks
Funder: US National Science Foundation (NSF) grants DMS-2113671 and DMS-2311299
About probability and statistics
To analyse networks, Min relies on theories and methods from the related fields of probability and statistics. “Probability is the mathematical study of randomness and uncertainty, while statistics is the mathematical study of discovering information and patterns from data,” explains Min. “Statistics uses probability to distinguish useful information from sheer coincidence in the data.”
Researchers use probability and statistics to understand the relationships between sets of data and to create models (mathematical representations of real-world scenarios) that describe them. For example, a researcher could statistically analyse a dataset and use this information to create a mathematical model that represents the data. Then, they could use this model to probabilistically predict the outcome of a future scenario. “In summary, probability tells us how a model produces data, while statistics uses probability theory to find a good model for a given dataset,” says Min.
How can probability and statistics help us in day-to-day life?
“Everything in the world has randomness,” says Min. “But, as humans, we are inherently bad at thinking about randomness.” For example, in 2010, an octopus named Paul correctly ‘predicted’ the outcome of 12 out of 14 matches in the football World Cup. As a result of his initial success, many people started placing bets based on his predictions. “However, we can reason that, based on the data and the fact that many other animals were also unsuccessfully ‘predicting’ the outcome of matches, it is most likely that Paul was just making random guesses,” explains Min. Rather than being a psychic octopus, probability and statistics tell us that Paul simply got lucky.
“Humans tend to be over-confident in the conclusions that we draw from data,” says Min. This may be due to a variety of biases, such as confirmation bias (the tendency to interpret information in a way that confirms our pre-existing ideas) or recency bias (placing more significance on recent events than historical events). “Understanding statistics and probability helps us overcome these biases and make better decisions,” says Min.
Pathway from school to probability and statistics
• At school, you will learn the basics of probability and statistics in mathematics classes.
• Min also recommends learning computer programming (“Python is the best programming language to learn,” he says), as this is a key skill for statistically analysing data and building probabilistic models.
• There are lots of online videos and tutorials where you can learn about statistical methods of data analysis and programming (e.g., www.learnpython.org). Gaining practical experience of programming is very important. “Learning probability without being able to create computer models is like learning chemistry without being able to do experiments,” says Min.
• At university, degrees in statistics, mathematics, data science or computer science will all offer classes in statistics and probability.
Explore careers in probability and statistics
• “Statistics and probability are the foundation of data science, and data science is one of the hottest jobs around at the moment, due to the huge amounts of data we are continuously creating,” says Min. “Today’s computers and internet connectivity mean we are generating far more data than we know what to do with.”
• Knowledge of statistics and probability is vital in all fields of science. “A big part of a statistician’s job is to help other scientists!” says Min. “Many scientists know all about their specific field of interest, but they don’t know how to use the latest statistical models and methods.” This means many research projects require a trained statistician, so you could find yourself collaborating with anyone, from astrophysicists to zoologists, to help them analyse their data.
• The American Statistical Association has a wealth of resources, including information about careers in statistics and fun practical statistics activities: www.amstat.org/education/k-12-student-outreach
• The Royal Statistical Society lists some of the many jobs for statisticians: www.rss.org.uk/jobs-careers/career-development/types-of-job
Meet Min
I didn’t like math until college. Initially, I was interested in architecture and physics, as I enjoyed building things and thought it was so beautiful how a few simple physical laws could explain so much of the world. At school, math was all about following complicated rules and formulas. It wasn’t until college that I realised you can be very creative with mathematics. I discovered that instead of following the rules and formulas, you can invent them!
During my undergraduate degree in electrical engineering and computer science, I took a class in artificial intelligence (AI) and loved the math behind it. I thought machine learning was the perfect place to understand AI from a mathematical perspective, so I did a PhD in machine learning. I ended up as a statistician when I realised that statistics is the foundation of machine learning.
The Bayes rule is my favourite fact about statistics. Personally, I think it is the most important theorem in probability and statistics, and it is also extremely useful in real life. Many bad decisions have been made because the people involved did not fully understand the Bayes rule. A famous example is from a legal case in 1996, in which both the judge and jury were confused by the Bayes rule when trying to use Bayesian statistics to help determine the likelihood of DNA evidence belonging to a suspect, possibly leading to a wrongful conviction.
When I’m not analysing networks, I like being outdoors, either playing tennis, running long distances or hiking in nature. I also enjoy reading and listening to audiobooks. I can’t think of anything better than to go on a long hike in a beautiful area while listening to an audiobook.
Min’s top tip
Don’t give up too early. When studying probability, statistics and machine learning, there are many points when things will suddenly feel impossibly difficult or complicated. This happens to everyone. Be patient and trust that it will get easier over time.
Meet Po-Ling
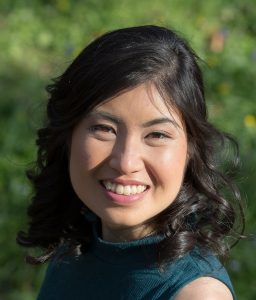
Professor Po-Ling Loh is a statistician at the University of Cambridge, UK, who collaborates with Min.
I come from a very mathematical family. My father is a statistics professor, my mother has an undergraduate degree in math, and my two older brothers were interested in math from a very young age. This meant that, while my favourite subjects in different years of school were biology and American history, I grew up with the idea that everyone liked math and it was the most natural way to reason about the world.
It is important to realise that everyone’s life journey is unique. Growing up with my family background in the university town of Madison in Wisconsin, USA, I thought it was completely normal for everyone to earn a PhD and become a professor. However, as I’ve seen more of the world, I’ve come to appreciate that this is not the case. A PhD is not for everyone, and I’m not sure I would suggest that younger people follow in my footsteps!
I conduct high-dimensional statistics research in the field of theoretical statistics. This involves determining how to perform estimation when the number of samples is relatively small compared to the number of parameters one wishes to estimate. I also develop new methods for making statistical procedures robust and private. This research has real-world applications in medical imaging, where images of the body can be viewed as high-dimensional objects that must be estimated in accurate, robust and potentially private ways.
I have two young daughters, so most of my free time is spent reading the Berenstain Bears and books by Richard Scarry. Prior to having kids, my favourite leisure activities included baking, singing and cycling.
Po-Ling’s top tip
If you aspire to becoming an academic, it is important to figure out your own strengths and capitalise on them. This will lead to a smoother path and one with more potential to make deeper and more satisfying contributions. For example, are you good at making novel connections between existing topics? Do you derive a thrill from cracking open hard problems? Do you love coding up complex algorithms and making them more efficient?
Do you have a question for Min?
Write it in the comments box below and Min will get back to you. (Remember, researchers are very busy people, so you may have to wait a few days.)

